Fusion of Aeromagnetic Data and Satellite Images for Delineation
of Lineaments –
K. A. Elsayed
Zeinelabdein
Alneelain University, P.O. Box 12702,
kalsayed2001@yahoo.com, Khartoum, Sudan.
Abstract
1. Introduction
Till 1977 the geology of
The basin was mapped in three
horizons (approximately Eocene, Paleocene and basement). Structurally, the
majority of the basin area is enclosed between two major faults trending
NNW-SSE. Trapping styles identifed in the area are fault-related and can be
defined as either tilted fault-blocks or fault-bounded anticlines (RRI, 1989).
The
aim of image fusion is to integrate different data in order to obtain more
information than can be derived from each of the single sensor data alone (Pohl
and Van Gendren, 1998). Image fusion is performed at three different processing
levels according to the stage at which the fusion takes place. These are:
pixel, feature and decision level. It aims at the integration of disparate and
complementary data to enhance the information apparent in the images as well as
to increase the reliability of the interpretation (Pohl and Van Gendren, 1998).
In this study, the objective of image fusion is to sharpen the image by
increasing its spatial resolution by merging panchromatic band with Landsat TM
bands and to reveal the subsurface structures by integrating satellite images
with aeromagnetic data.
2.
Data Types
The analysis of multi-source remotely sensed data can
provide rich, reliable and useful information. Two data types were used in this
study: remote sensing data: 5 TM and 5 ETM scenes (see table 1) and
aeromagnetic data. Aeroagnetic data for
Table (1)
Remote sensing data types
|
Image |
Date |
Image |
Date |
|
TM 171-54 |
|
ETM 171-54 |
|
|
TM 172-53 |
|
ETM 172-53 |
|
|
TM 172-54 |
|
ETM 172-54 |
|
|
TM 173-53 |
|
ETM 173-53 |
|
|
TM 173-54 |
|
ETM 173-54 |
|
3. Digital Image Processing:
3.1 Pre-processing
Digital
image processing techniques were performed with special emphasis on spatial
enhancements to extract lineament features within the study area. Image
pre-processing was carried out including radiometric and geometric corrections.
All bands were transformed into UTM coordinate system. Mosaics for the
different multispectral bands and panchromatic band were prepared. These
mosaics were then subset to portray
3.2 Image fusion
After having transformed the dataset into the same coordinate system,
the images were fused to produce images which have better spatial and spectral
characteristics. To this end, three approaches have been utilized:
3.2.1 Multiplicative
A first method to consider is the multiplicative
technique. This technique requires several chromatic components and a multiplicative
component, which is assigned to the image intensity. In this study, the
chromatic components are multispectral TM bands; the panchromatic or
aeromagnetic image is input multiplicatively as intensity.
3.2.2 IHS transforms
This is a common technique that uses the RGB to IHS
transforms. In this technique, an RGB color composite of bands (or band
derivatives, such as ratios) is transformed into IHS color space. The intensity
component is replaced by the grey image, and the scene is then reversely
transformed. This technique integrally merges the two data types (Erdas field
guide, 1999).
3.2.3 Principal Component Analysis (PCA)
The principal component analysis is a statistical technique
that transforms a multi variate inter-correlated dataset into a new
uncorrelated dataset (Zhang, 2002). The purpose of PCA is to compress all of
the information contained in an original n-band dataset into a fewer than n
“new bands” or components.
4. Results and Discussions
In order to achieve the objectives of this study,
fusion of both panchromatic band of ETM+ sensor with TM bands and Landsat
images with aeromagnetic data were utilized using resolution merge and sensor
merge functions, respectively.
Panchromatic images of Landsat ETM+ sensor has one
broad band with very good spatial resolution —14.25 m. TM sensors have six
bands with a spatial resolution of 28.5 m. Combining these two images to yield
a six-band data set with 14.25 m resolution provides the best spatial and
spectral characteristics of both sensors.
In the first step, fusion of panchromatic and TM
bands was performed using mosaics of either the images that portray the entire
area of
The second step includes fusion of aeromagnetic
data with satellite images that serves to reveal subsurface structures in the
study area. Results of this step are shown in plates 4, 5 & 6 utilizing the
same techniques mentioned above.
From plates 1, 2 & 3 it is clear that the
resolution of Landsat images was increased to 14.25m. The sharpness of these
images was also increased which in turn enables the successful delineation of
lineaments within the covered area. On the other hand, the spectral
characteristics of TM images were degraded greatly when fused with aeromagnetic
data (see plates 4, 5 & 6). This may be due to clustering of the majority
of aeromagnetic data in a narrow range of values while the rest is spreading in
a relatively wide range of values. This opinion is supported by the fact that
this distortion is not homogenous all over the area. This may conclude that
even though when the histogram of the aeromagnetic data was rescaled to match
the histogram of the intensity component or PC1 of the TM images, the internal
distribution variations still influence the quality of the resulting image.
This disadvantage came at the expense of exposing the subsurface structures
which takes an interest in the current study.
In the final step, all the produced images from fusion of different data types applying different merging techniques were imported in GIS environment. Then lineaments were interactively delineated using one image at a time. By the end of this step a lineament map of the study area was produced (see fig. 1). This map may be used as a guide when exploration works are to be conducted. This map was further divided into 5 zones according to perspectivity. Zone 1 is the most perspective followed by zone 2. Zone 3 and 4 are moderately perspective while zone 5 is less perspective.
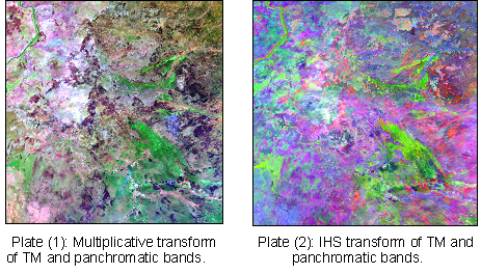
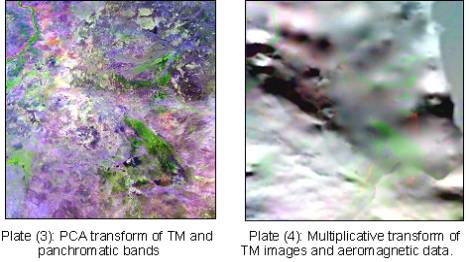
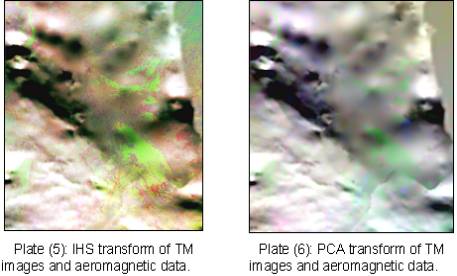
fig. (1): Lineament map of
5. Conclusions
Lineament features are of great importance in
References
1.
ERDAS field guide, 1999. On-Line Manuals version 8.4,
2.
Pohl, C.
and Van Genderen, J. L., 1998. Multisensor image fusion in remote sensing:
concepts, methods and applications. International Journal of Remote Sensing,
Vol. 19, pp. 823-854.
3.
Ropertson
Research International (RRI) and Geological Research Authority of Sudan (GRAS),
The Geology and Petroleum Potential of southeastern Central and
4.
Zhang Y. 2002. Problems in the
fusion of commercial high-resolution satelitte images as well as landsat 7
images and initial solutions. International Archives of Photogrammetry and
Remote Sensing (IAPRS), Volume 34, Part 4 “GeoSpatial Theory, Processing and
Applications”.